
The Developer Tools are built into all major browsers, requiring no additional installation. You can open them by pressing F12 or by right-clicking the page and selecting 'Inspect'. Originally designed for web developers, they provide a straightforward observation perspective for anyone wanting to understand what is happening behind the scenes of a webpage.
Elements Panel: See the Real Structure of the Page
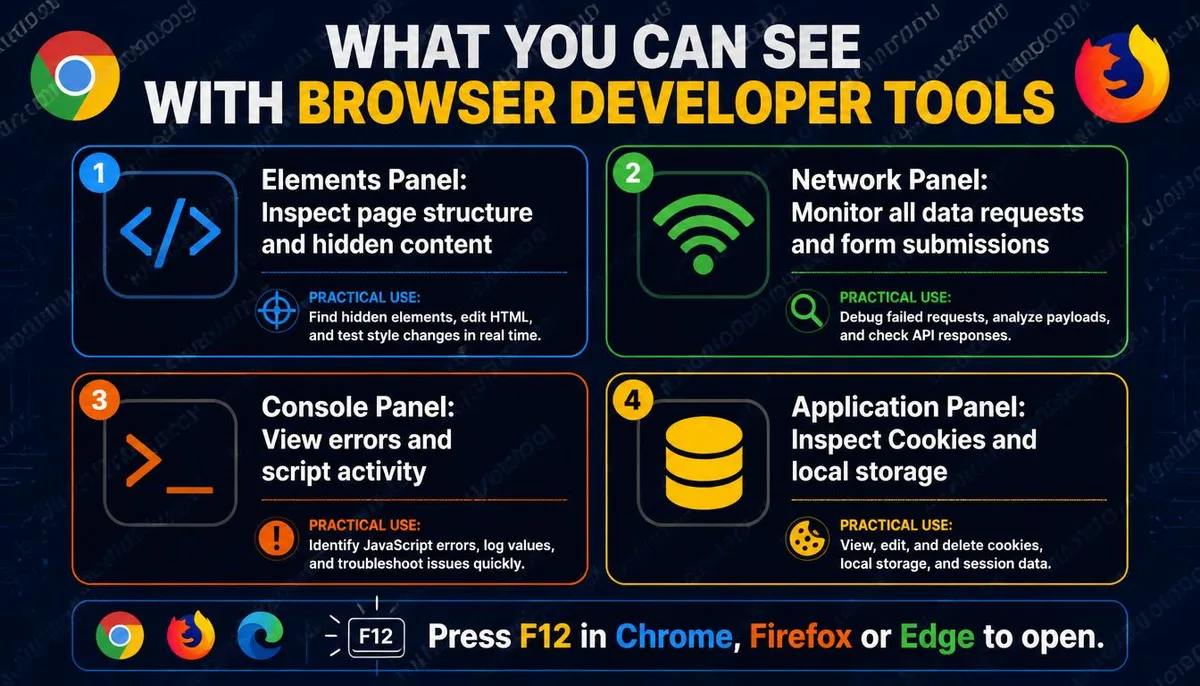
When you open the Developer Tools, the Elements panel is usually displayed by default, showing the HTML structure of the page. Every element you see on the page, like text, images, buttons, and forms, corresponds to a segment of HTML code here. By clicking the cursor icon in the top left corner of the panel and hovering over any element on the page, the Developer Tools will automatically jump to the corresponding HTML location. This feature has several practical use cases: View Hidden Page Elements Some websites set certain content to be hidden, such as collapsed descriptions, hidden form fields, or prompts that only appear under specific conditions. These contents can still be seen in the Elements panel, even if they are not visible on the page. Confirm the Real Target of Links Finding a button or link's corresponding HTML in the Elements panel allows you to see the actual URL it points to, confirming whether it matches the displayed text. This is very useful when assessing suspicious links.
Network Panel: Monitor What Data the Page Sends to Servers
The Network panel is one of the most valuable parts of the Developer Tools for cybersecurity analysis. After opening the Network panel, reload the page; the panel will show all network requests made during the loading process, including the target URLs of the requests, the data sent, the server's responses, and the time taken for each request. What You Can Use This For: See which third-party domains a website sends requests to, confirming whether there are any unexpected data transmission targets. An ordinary news website might send requests to dozens of ad and tracking service servers that are completely invisible during normal browsing. Confirm the target of form submissions. When you fill out a form on a page and submit it, the Network panel will show which URL this data is actually sent to, which can be used to validate whether the claimed official site correctly transmits form data to the official server.
Console Panel: Observe Page Errors and Execution Messages
The Console panel displays records of JavaScript execution on the page, including error messages, warnings, and debug outputs written by developers in the code. For the average user, the Console's most straightforward use is to observe whether there are any abnormal errors on the page or if any unknown external scripts are executing. In the input line of the Console panel, you can enter JavaScript commands to execute directly on the current page. This feature allows developers to quickly test code, but it also represents a potential entry point for social engineering attacks. Some scams ask users to copy and paste a piece of code into the Console for execution, claiming it can complete a specific action, when in fact it's exploiting the user's actions to execute malicious commands. In any case, you should never paste code from unknown sources into the Console.
Application Panel: View Data the Website Stores on Your Device
The Application panel displays the data that websites store in your browser, including cookies, LocalStorage, and SessionStorage. View Cookies In the left menu of the Application panel, find Cookies and select the current website domain to see all cookies set by this website in your browser, including cookie names, contents, expiration dates, and whether they have HttpOnly or Secure flags set. This allows you to see directly which cookies are used for tracking purposes, which are functional login credentials, and how long these cookies are set to expire.
Using Developer Tools to Assess the Credibility of a Website
F12 Developer Tools can serve as an auxiliary tool in judging the trustworthiness of a website. The following observation points can serve as a reference: Confirm the Submission Target of Forms Input test data on a suspicious login page and observe the target URL of the form submission in the Network panel. If a website claiming to be a Google or Facebook login page has a form submission target that is not accounts.google.com or facebook.com, it is a clear indicator of a phishing page. Check the Sources of External Resources Loaded by the Page In the Network panel, confirm whether the main resources loaded by the page all come from the claimed official domain or from a large number of unrelated third-party domains. Confirm Information about the SSL Certificate Click on the padlock icon next to the address bar to view which entity issued the SSL certificate for the website, as well as the certificate's expiration date and domain information. Genuine official websites typically have EV certificates corresponding to the official organization name, or at least confirm that the certificate's domain matches the address in the address bar. Further reading: Fake Google ads
Frequently Asked Questions About F12 Developer Tools
Is it legal to view a website's source code using F12?
Viewing the front-end source code of a webpage, which is HTML, CSS, and JavaScript that the browser has downloaded to your device and uses to render the page, is completely legal. Browsers must download this code to present the page, and F12 lets you view content that is already on your device. Situations where boundaries should be noted include attempts to bypass website access restrictions via Developer Tools, modifying requests to obtain unauthorized data, or using the tools for website testing. These operations, when done without authorization, may involve legal issues. Purely viewing and observing does not constitute legal problems.
Does executing commands in the Console affect the website's server?
No direct impact. JavaScript commands executed in the Console operate within your own browser environment and do not directly affect the website’s server; they change the local rendering status of this page in your browser and revert after you reload the page. However, if the executed command includes actions that send requests to the server, such as submitting a form or triggering an API call, that is not just a local change. Regardless, do not execute any Console commands from unknown sources.
The data displayed in the Network panel is too much; how can I quickly find useful information?
The Network panel provides several filtering functions to help narrow down the range. You can input keywords in the filter bar at the top of the panel to filter specific requests; for example, entering part of a domain name of interest will only display related requests. Type filters allow you to view only XHR or Fetch type requests, which are often actions that send data in the background. By filtering out images and stylesheets, meaningful data requests become easier to identify. For situations where you want to confirm the target of form submissions, observing any new requests that appear in the Network panel at the moment of form submission can often quickly lead you to the target.
One Key Takeaway: The F12 Developer Tools allow anyone to see the technical details beneath the surface of a webpage, from confirming the form submission targets to observing the tracking behaviors on the page. It is a web analysis tool that can be used without any technical background and is one of the most direct aids for assessing suspicious websites.